Leave Your Message
Choosing a laboratory water system is not a simple equipment purchase. It affects sample preparation, instrument performance, cleaning procedures, and daily research reliability. A suitable Lab Water Purification System should match your applications, water quality requirements, and available facilities. The clearest choice often begins with the samples, not the product brochure.
In practice, laboratories may need different water grades for buffer preparation, cell culture, chromatography, or trace analysis. A visible resistivity display is useful, but it cannot replace routine monitoring and documented maintenance. Check feed-water quality, flow rate, storage capacity, filter life, installation needs, and total operating cost. Also review the manufacturer’s validation documents, technical support, and service history. These details matter during a busy afternoon when a clogged prefilter interrupts a critical experiment.
Small details count.
Experienced users should compare system specifications with recognized laboratory methods and instrument manuals. Ask whether the system provides consistent quality under real workload, not only ideal conditions. Consider microbial control, endotoxin concerns, organic removal, and final filtration when the application requires them. Water quality can drift quietly. That risk deserves attention.
No single system suits every laboratory. A lower-cost option may become expensive when cartridges change frequently or maintenance is difficult. Conversely, an advanced unit may provide features your team never uses. Review your actual workflow, consult qualified water specialists, and record performance after installation. Even careful selection can miss something. That is why feedback from analysts, facilities staff, and service engineers should shape the final decision.
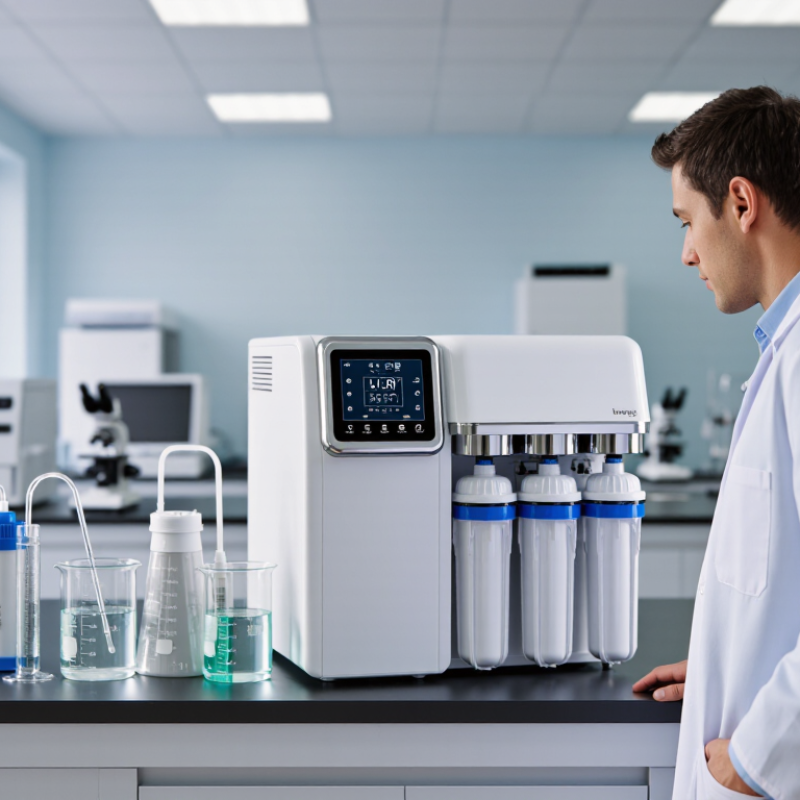
Choosing a lab water purification system begins with the water quality your methods truly require. For ASTM Type I water, resistivity can reach 18.2 MΩ·cm at 25°C. This value indicates extremely low ionic contamination. It does not prove that every impurity is absent. It is not enough.
Review your protocols, instruments, and sample sensitivity before comparing systems. Molecular biology may require low nuclease levels, while trace analysis may demand reduced total organic carbon and metals. Cell culture can also require controlled endotoxin levels. Measure at the point of use. Temperature affects resistivity, so readings need clear compensation and calibration records. A display showing 18.2 MΩ·cm may look reassuring, yet poor maintenance can hide problems in filters, tubing, or storage tanks. Small details matter.
Ask for documented performance data, service intervals, sanitization procedures, and replacement costs. Experienced laboratory staff should check whether the system can deliver stable Type I water during peak demand, not only during a short demonstration. I have seen specifications receive more attention than daily workflow, which is an easy mistake. Consider the distance between the purifier and the instrument. Long tubing runs may introduce particles or biological growth. Keep a basic log for resistivity, TOC, filter changes, and unusual odors. That record supports troubleshooting and helps confirm whether the selected system remains suitable as testing needs change.
| No. | Selection Dimension | Recommended Specification or Checkpoint | Why It Matters | Practical Decision Guide |
|---|---|---|---|---|
| 1 | Define the required water grade | Type I ultrapure water commonly reaches 18.2 MΩ·cm at 25°C. Type II and Type III water have lower resistivity requirements and are commonly used for general laboratory preparation, washing, or feedwater. | Using a higher grade than necessary can increase purchase, operating, and maintenance costs without improving the result. | Select Type I for sensitive analytical, molecular biology, trace-element, or instrument applications; select lower grades for routine tasks when method requirements allow. |
| 2 | Confirm resistivity and temperature reference | Specify resistivity in MΩ·cm at 25°C. A value of 18.2 MΩ·cm is the theoretical maximum for pure water at 25°C. | Resistivity changes with temperature and ionic contamination, so readings without temperature compensation may be misleading. | Require automatic temperature compensation and a display or data record showing the compensated value. |
| 3 | Evaluate total organic carbon (TOC) | For many ultrapure applications, a typical target is TOC ≤10 ppb; more demanding analytical workflows may require a lower validated limit. | Organic contaminants can interfere with chromatography, spectroscopy, cell culture, and molecular biology procedures. | Choose a system with a suitable polishing stage and an online TOC monitor when low-organic background is critical. |
| 4 | Check microbial and endotoxin control | Consider a final-point filter, hygienic recirculation, ultraviolet treatment, and endotoxin control where biological or cell-based work requires it. | Water purity can deteriorate during storage and distribution even when the water initially meets its specification. | Request validated microbial and endotoxin performance data rather than relying only on resistivity. |
| 5 | Match the system to feedwater quality | Review feedwater hardness, chlorine, chloramine, silica, conductivity, iron, and microbial load before selecting pretreatment. | Variable or heavily contaminated feedwater can shorten cartridge life and reduce reverse-osmosis or deionization performance. | Obtain a recent water analysis and include sediment filtration, carbon treatment, softening, or reverse osmosis when justified. |
| 6 | Size daily volume and peak flow | Record average daily consumption, maximum draw-off rate, number of users, and the volume required for rinsing or instrument supply. | A system may meet purity specifications but still fail operationally if production or dispensing capacity is insufficient. | Select production capacity and storage volume with reasonable allowance for peak demand and future expansion. |
| 7 | Review monitoring and alarms | Look for continuous resistivity or conductivity monitoring, TOC monitoring when needed, filter-life indicators, leak detection, and audible or visual alarms. | Continuous monitoring helps identify declining quality before contaminated water reaches an experiment or instrument. | Prefer systems that record critical parameters and provide clear alert thresholds linked to laboratory procedures. |
| 8 | Assess storage and dispensing design | Evaluate tank size, recirculation, protected vents, dispensing-point filtration, tubing materials, and the distance between the purifier and point of use. | Storage tanks and distribution loops can introduce particles, ions, organics, or microorganisms after purification. | Use short, clean distribution paths and recirculation or point-of-use polishing for critical applications. |
| 9 | Plan validation and compliance | Define acceptance criteria for resistivity, TOC, microbial limits, endotoxin, particles, and other contaminants relevant to the laboratory methods. | Documented qualification and routine verification support reproducible results and audit readiness. | Request installation, operational, and performance qualification support when required by the quality system. |
| 10 | Calculate lifecycle cost and service needs | Include purchase price, electricity, water rejection, replacement cartridges, sanitization, calibration, labor, service contracts, and downtime. | Consumables and maintenance often account for a substantial share of the system’s long-term cost. | Compare at least three years of operating cost and confirm the availability of replacement parts, technical support, and preventive maintenance. |
Note: Water-quality targets should be specified according to the applicable laboratory method, instrument requirements, and current water-quality standards. Resistivity, TOC, microbial, and endotoxin values shown above are selection guidelines and should be validated for the intended use.