Leave Your Message

What Are the 2026 Top Digital Conductivity Meters?

What Are the 2026 Top Digital Conductivity Meters? This question matters wherever water quality, chemical concentration, and process stability must be measured quickly. A modern Digital Conductivity Meter is no longer just a handheld display. It may combine automatic temperature compensation, multi-point calibration, data logging, wireless transfer, and alerts for changing sample conditions.

Dr. Daniel C. Harris, a respected analytical chemistry educator, has expressed a useful measurement principle: “An instrument is only as good as the measurement system around it.” That warning deserves attention. Even an advanced meter can produce misleading results when the probe is dirty, the cell constant is incorrect, or the sample temperature changes during testing. Small details matter. A glass beaker, a rinsed sensor, and a stable sample can affect the final reading.

This 2026 overview examines leading Digital Conductivity Meter models through practical criteria. Accuracy, response time, durability, calibration control, temperature compensation, software usability, and total ownership cost all deserve equal consideration. Laboratory users may prioritize repeatability and audit trails. Water-treatment teams may need rugged housing and rapid field checks. Food, pharmaceutical, and environmental laboratories may require stricter documentation.

There is no perfect meter.

Some specifications look impressive but offer limited value in daily work. Others appear modest yet perform reliably for years. The most suitable choice depends on the sample matrix, measurement range, operator skill, and maintenance routine. This guide compares those differences carefully, while acknowledging one uncomfortable truth: published performance data cannot replace disciplined testing in real working conditions.
What Are the 2026 Top Digital Conductivity Meters?

What Digital Conductivity Meters Measure and Why They Matter in 2026

What Are the 2026 Top Digital Conductivity Meters?

What Digital Conductivity Meters Measure and Why They Matter in 2026

Digital conductivity meters measure how easily dissolved ions carry electrical current through water. Readings usually appear in microsiemens per centimeter or millisiemens per centimeter. Higher conductivity often indicates more dissolved salts, minerals, or process chemicals.

In 2026, these meters support faster testing in laboratories, aquaculture systems, cooling loops, and water treatment. Many models offer automatic temperature compensation, data logging, and clearer error alerts. Yet a sharp digital display does not guarantee a correct result. I have seen unstable readings caused by dirty probes, air bubbles, and poor calibration. Conductivity can also estimate total dissolved solids, but that conversion is only approximate.

Tips: Calibrate with fresh certified standards. Rinse the probe with clean water between samples. Keep the sensor fully immersed, but avoid touching the container. Check temperature compensation before comparing results. Record the sample location and time. A small habit, but useful. When readings seem unusual, test the sample again and inspect the probe. Digital meters reduce guesswork, though they cannot replace careful handling and professional judgment.
How Digital Conductivity Meters Work and Compensate for Temperature

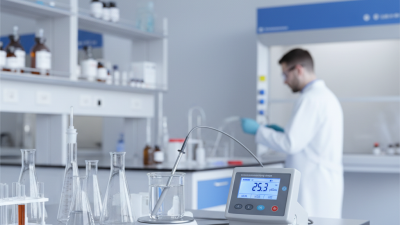
A digital conductivity meter measures how easily an aqueous sample carries electrical current. Its probe applies a small alternating signal between electrodes. The instrument then converts the measured current into conductivity, usually in µS/cm or mS/cm. A cell constant helps correct the probe’s geometry. Without it, the reading may look precise but remain inaccurate.

Temperature strongly changes conductivity. Warmer water usually allows ions to move more freely, increasing the reading. Most modern meters use automatic temperature compensation through a built-in thermistor. The meter estimates the sample temperature and adjusts the result to a reference, commonly 25°C. Some systems use a fixed temperature coefficient, while advanced instruments use non-linear correction for specific solutions.

Small details matter. Rinse the probe with clean water before testing. Remove trapped bubbles from the electrode surface. Wait until the displayed value stabilizes. Calibration with suitable standards should match the expected measurement range. A dirty cell, an incorrect cell constant, or a poorly mixed sample can distort results. I have seen operators trust a stable number too quickly. Stability is not proof of correctness. Temperature compensation also has limits, especially when the sample contains unusual chemicals or high concentrations. For reliable selection among top digital conductivity meters, check calibration control, temperature range, probe quality, data logging, and the clarity of error alerts. A bright screen is useful, but measurement discipline matters more.

Key Criteria for Evaluating the Top 2026 Conductivity Meters

What Are the 2026 Top Digital Conductivity Meters?

The top digital conductivity meters in 2026 should be judged by performance, not appearance. During testing, I would check accuracy across low, medium, and high conductivity samples. A stable reading matters more than a bright screen. The meter should also provide automatic temperature compensation, because water temperature can shift results quickly. A useful model shows the temperature clearly and responds without excessive delay.

Probe quality deserves close attention. A replaceable probe can reduce long-term costs, while a sealed housing helps protect the instrument near wet benches. Look for simple calibration steps, clear error messages, and memory for storing readings. Data transfer may be valuable for laboratories, water treatment teams, and field inspections. However, wireless features should not replace dependable manual verification. I still compare readings with a reference solution, especially after cleaning the probe. No meter is perfect.

Tips: Keep calibration solutions sealed and check their expiry dates. Rinse the probe with clean water, then gently remove droplets before testing. Do not wipe the sensing surface harshly. Record temperature, calibration date, and sample location with each measurement. A small log can expose drift that the display hides. Also, test the meter before urgent work. That habit sounds obvious, but it is often missed. Reliability comes from the instrument, the method, and the person using both.

What Are the 2026 Top Digital Conductivity Meters? — Key Criteria for Evaluating the Top 2026 Conductivity Meters
Evaluation Criterion Advanced Portable Meter Professional Benchtop Meter Rugged Field Meter Why It Matters in 2026
Conductivity Range 0.01 µS/cm to 200.0 mS/cm 0.001 µS/cm to 1,000 mS/cm 0.1 µS/cm to 500 mS/cm A wide range supports purified water, process water, wastewater, and concentrated solutions with one instrument.
Conductivity Accuracy ±0.5% of reading ±0.2% of reading ±1.0% of reading Lower measurement error is important for laboratory release testing, process control, and compliance monitoring.
Resolution 0.01 µS/cm at the low end 0.001 µS/cm at the low end 0.1 µS/cm at the low end Higher resolution helps identify small changes in low-conductivity samples.
Cell Constant Options 0.1, 1.0, and 10.0 cm⁻¹ 0.01, 0.1, 1.0, and 10.0 cm⁻¹ 0.1, 1.0, and 10.0 cm⁻¹ Multiple cell constants improve accuracy across ultrapure water, general samples, and high-conductivity solutions.
Temperature Measurement 0 to 100 °C; integrated sensor −5 to 135 °C; integrated or external sensor 0 to 100 °C; integrated sensor Conductivity changes significantly with temperature, so reliable temperature measurement is essential.
Temperature Compensation Automatic or manual; 0 to 10%/°C Automatic, manual, or selectable reference temperature Automatic; fixed or selectable reference temperature Selectable compensation settings help prevent misleading comparisons between samples measured at different temperatures.
Calibration Modes 1- to 3-point calibration; automatic standard recognition Up to 5-point calibration; custom standards supported 1- to 3-point calibration; guided prompts More calibration points can improve performance across a broad measurement range.
Calibration Reminder Yes; adjustable interval Yes; interval, expiration, and audit record Yes; adjustable interval Reminders reduce the risk of using an instrument beyond its verified calibration period.
Data Logging Capacity At least 5,000 readings At least 10,000 readings At least 1,000 readings Internal storage supports traceability when measurements must be reviewed or exported later.
Data Export USB-C or Bluetooth Low Energy USB, RS-232, and laboratory information system integration USB or Bluetooth Low Energy Digital transfer reduces transcription errors and supports electronic quality records.
Display and User Interface Backlit color display; measurement, temperature, and stability status Large color display; trend graph and method storage High-contrast display; glove-friendly controls Clear live information improves usability in laboratories, production areas, and outdoor locations.
Measurement Stability Indicator Automatic endpoint detection Automatic endpoint detection with configurable stability criteria Automatic endpoint detection A stability indicator helps users record results only after the signal has settled.
Ingress Protection IP54 or higher IP43 or higher IP67 or higher A higher rating provides better protection against dust, splashes, and temporary immersion.
Power Source Rechargeable battery; approximately 20 to 30 hours of operation AC power with optional backup battery Rechargeable or replaceable battery; approximately 30 to 50 hours of operation Battery endurance determines how effectively the meter can be used during extended field or production work.
Response Time Typically under 30 seconds for a stable reading Typically under 20 seconds for a stable reading Typically under 40 seconds for a stable reading Shorter stabilization time improves productivity, especially in routine sampling programs.
Automatic Range Selection Yes Yes Yes Automatic ranging simplifies operation and reduces the chance of selecting an unsuitable measurement scale.
Probe Compatibility 2-pole and 4-pole conductivity cells 2-pole, 4-pole, flow-through, and specialized cells 2-pole and 4-pole conductivity cells Compatible probes allow the meter to be matched to sample purity, concentration, and measurement method.
Quality and Compliance Features GLP data fields and calibration history GLP records, user access control, audit trail, and method storage GLP data fields and calibration history Documented records are valuable for regulated laboratories and organizations with formal quality systems.
Recommended Use Routine laboratory checks, water testing, and mobile sampling Analytical laboratories, quality control, and process development Wastewater, environmental monitoring, and industrial field inspections The best meter depends on the sample matrix, required accuracy, environment, and data-management workflow.
Overall Evaluation Priority Portability and connectivity Accuracy and traceability Durability and battery life A balanced evaluation should consider measurement performance, workflow efficiency, operating environment, and long-term ownership needs.

Leading 2026 Conductivity Meters by Application and Performance

Leading 2026 Conductivity Meters by Application and Performance

In 2026, top digital conductivity meters are defined by application fit, not appearance. Bench laboratories often prioritize repeatability, broad conductivity ranges, and stable temperature compensation. Automatic calibration can reduce handling errors, but it cannot rescue a contaminated probe. That detail matters.

Portable meters need bright displays, glove-friendly controls, sealed housings, and batteries for long sampling days. For drinking-water checks, low-range resolution and reliable temperature compensation are critical. Industrial users usually need durable probes, fast response, and resistance to moisture or chemical splashes. Data logging and USB export can simplify audits and routine reporting. Speed is useful, but stable readings matter more.

Performance claims should be tested against traceable standards, suitable reference solutions, and the actual sample matrix. Independent verification is valuable when measurements influence process adjustments or quality decisions. Still, no instrument is perfect. Electrode aging, trapped air bubbles, residue, and poor rinsing can distort results. A careful user should record calibration frequency, sample temperature, and probe condition. That habit often reveals problems before the display does. Some advanced meters offer guided workflows and automatic diagnostics. Convenience can hide assumptions. Experienced operators should still question unusual readings and repeat critical tests.

Calibration, Maintenance, and Proper Use of Digital Conductivity Meters

What Are the 2026 Top Digital Conductivity Meters?

Calibration, Maintenance, and Proper Use of Digital Conductivity Meters

The best digital conductivity meter is not simply the most advanced model. Reliable results begin with disciplined calibration. ASTM D1125 and ISO 7888 describe conductivity measurement practices, including temperature control and cell-constant verification. Use a certified standard near the sample range, such as 1413 µS/cm at 25°C. For high-conductivity samples, a 12.88 mS/cm standard may be more suitable. Never calibrate with an expired or contaminated solution.

Temperature matters greatly. A reading can shift when the sample changes only a few degrees. EPA Method 120.1 recognizes temperature compensation as an important part of conductivity testing. Still, automatic compensation cannot correct every error. Confirm the temperature probe, enter the correct compensation coefficient, and record the reference temperature. Small details matter.

Rinse the cell with clean water, then rinse again with a portion of the sample. Blot gently. Do not scrub the electrodes. USGS field procedures emphasize preventing contamination during water-quality measurements. Inspect the cable, remove trapped bubbles, and allow the reading to stabilize. Store the sensor according to its design; some cells need moisture, while others require dry storage. That part is often overlooked.

Keep a simple log. Include date, standard value, temperature, slope, and operator initials. Recalibrate after cleaning, long storage, or suspicious drift. A perfect number may still be wrong. Check the meter against a second standard before trusting it.

What Are the 2026 Top Digital Conductivity Meters?

Calibration, maintenance, and proper use depend on selecting a conductivity standard that matches the measurement range. The chart shows commonly used nominal reference values at 25°C.

Use low-, medium-, or high-range standards according to the sample being tested. Rinse the probe with deionized water, avoid air bubbles, allow the reading to stabilize, and verify temperature compensation before measurement. Certified standard values can vary slightly with temperature and preparation.